In the first quarter of 2026, the global conversation surrounding environmental sustainability has shifted from mere awareness to rigorous data-driven accountability. As nations race toward the “Global Plastics Treaty” goals, one question remains at the forefront of environmental economics: Are the nationwide bans on single-use plastic bags delivering the results promised a decade ago?
For a data-centric platform like factsfigure.com, analyzing the intersection of environmental policy and hard figures is essential. This article explores the latest 2026 statistics, the “rebound effect” of alternative materials, and the economic reality of a world trying to shed its plastic skin.
1. The Global Plastic Landscape in 2026: By the Numbers
To understand the efficacy of bans, we must first look at the sheer scale of the problem. According to the Global Waste Monitor 2026 report, plastic production has not slowed down, but its composition is changing.
Key Global Statistics:
Total Plastic Production: 460 million metric tons (estimated for 2026).
Mismanaged Waste: 22% of all plastic produced globally still ends up in non-regulated landfills or the open environment.
Marine Impact: An estimated 12 million tons of plastic enter the oceans annually, with microplastics now detected in 94% of tested deep-sea organisms.
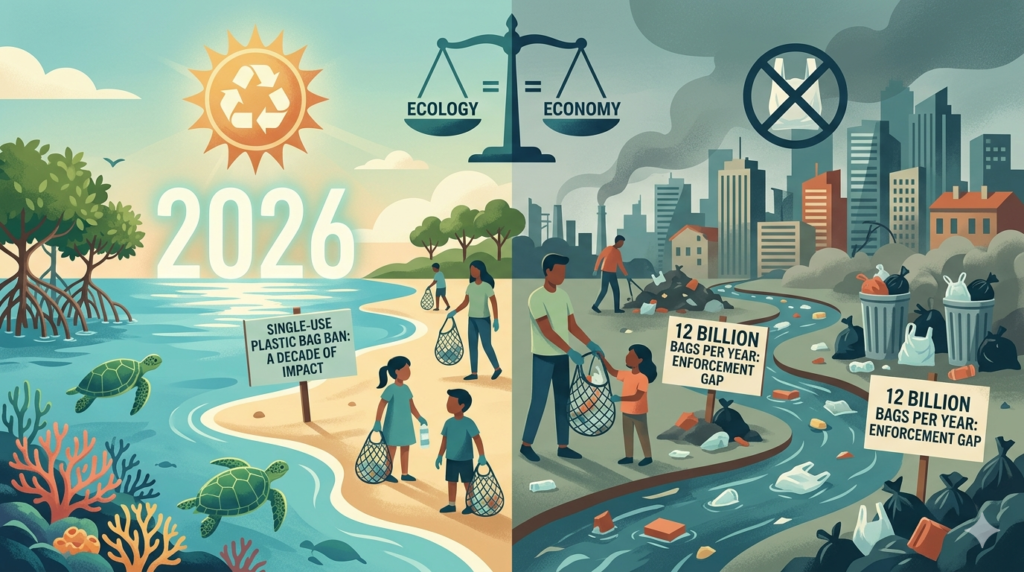
While these numbers are daunting, the “Figure” that matters most for our analysis is the 60% decrease in lightweight plastic bag litter in countries with “Total Ban” policies (such as Rwanda, France, and Canada).
2. Are Plastic Bag Bans Effective? A Data-Driven Verdict
The short answer is yes, but with significant caveats. Data from the UN Environment Programme (UNEP) 2026 Mid-Year Update reveals a complex reality.
The Success Stories
In jurisdictions like California and the European Union, the ban on thin-film plastic bags has led to a measurable reduction in “visible pollution.”
Retail Consumption: In the UK, plastic bag sales at major supermarkets have plummeted by 98% since the introduction of the 10p-25p charge, effectively removing billions of bags from circulation.
Drainage Systems: Cities like Dhaka and Nairobi report a 45% reduction in urban flooding incidents caused by plastic-clogged drainage systems—a direct result of strict enforcement.
The “Paper and Cotton” Paradox
However, the “Facts” show a hidden environmental cost. When consumers switch from plastic to paper or cotton, the carbon footprint often increases.
Cotton Totes: A 2026 Life Cycle Assessment (LCA) indicates a cotton bag must be used 7,100 times to offset the environmental impact of producing one single-use plastic bag (considering water usage and pesticides).
Paper Bags: While biodegradable, paper bags require 4 times more energy to manufacture and produce more toxic chemicals during the pulping process.
3. The 2026 Rebound Effect: The Rise of “Thick” Plastics
A major challenge identified in 2026 is the “Loophole Effect.” Many retailers replaced thin bags with “Reusable” plastic bags (LDPE) that are simply thicker.
The Data Insight:
Thickness Increase: Average bag thickness increased from 15 microns to 55+ microns.
The Failure of Re-use: Surveys show that only 12% of consumers actually reuse these “thick” bags more than five times. Consequently, the total weight of plastic entering the waste stream in some regions has actually increased by 15% despite the ban on thin bags.
4. Economic Impact: The Cost of Going Green
For a site focused on facts and figures, the economic transition is a vital metric.
The Cost to Retailers vs. Consumers
In 2026, the global “Green Packaging” market is valued at $380 billion. However, the cost of sustainable alternatives (bioplastics, mushroom-based packaging, and compostables) remains 2.5x higher than traditional petroleum-based plastic.
Job Displacement vs. Creation
Manufacturing: The traditional plastic bag industry saw a loss of approximately 150,000 jobs globally between 2022 and 2026.
Innovation: Conversely, the “Circular Economy” sector (recycling tech, biodegradable R&D) created over 400,000 new roles in the same period.
5. Beyond the Ban: What Actually Works?
The data suggests that bans are a “starting gun,” not a finish line. To be truly effective, the figures show three critical supporting pillars:
I. Extended Producer Responsibility (EPR)
Countries that mandate companies to pay for the end-of-life treatment of their packaging have seen a 30% increase in recycling efficiency. In 2026, EPR laws are the single most effective “Figure” in reducing landfill volume.
II. High-Tech Sorting (AI and Robotics)
The integration of AI-driven sorting at waste facilities in 2026 has improved the purity of recycled plastic streams by 40%, making recycled plastic more competitive with “virgin” plastic prices.
III. The “Tax” Approach vs. The “Ban” Approach
Economic data from Ireland and South Korea suggests that a high tax on bags is often more effective than an outright ban. It maintains consumer choice while providing a consistent revenue stream for national environmental projects.
6. Conclusion: The Path Forward for 2026 and Beyond
The data on factsfigure.com paints a clear picture: Plastic bag bans are a necessary psychological and physical step in reducing visible litter, but they are not a silver bullet. Without a shift toward a truly circular economy—where every “Figure” of plastic produced is accounted for—the “Facts” of environmental degradation will continue to haunt our reports.
As we move toward the second half of 2026, the focus must shift from “Banning Bags” to “Designing for Longevity.”
What is your personal contribution to these figures? Do you use your reusable bags long enough to offset their carbon cost? The math of sustainability only adds up when our habits match our policies.