When we talk about smartphones as assets, we must confront the reality of “Value Bleed.” Every mobile device begins its journey toward zero value the moment the box is opened, but the rate of that decline—the “Depreciation Slope”—varies wildly between market segments. At factsfigure.com, our goal is to quantify these losses to help you understand the long-term ROI of your technology choices. In 2026, where flagship prices often exceed $1,200 and entry-level phones sit comfortably at $200, the stakes for your secondary market return have never been higher.
The Flagship Premium: Understanding the “Brand Equity” Dividend
Flagship smartphones from dominant players like Apple and Samsung carry what I call a “Brand Equity Dividend.” Because these devices are built with premium materials and supported by long-term software update commitments—often reaching seven years in the current market—they retain a much higher percentage of their original value.
The data reveals a fascinating “Retainment Metric.” A flagship device typically retains 60% to 70% of its value after the first twelve months. This is largely due to the “Secondary Market Liquidity”—there is always a buyer for a used high-end device. From a personal financial standpoint, the higher upfront cost of a flagship is often offset by this residual value. If you buy a phone for $1,000 and sell it a year later for $650, your “Realized Cost of Ownership” is only $350. This is the “Secret Figure” that savvy tech investors use to justify staying on the cutting edge of technology.
The Entry-Level Trap: Measuring the “Instant Depreciation” Fact
In contrast, entry-level devices suffer from what I categorize as “Instant Depreciation.” These phones are often built with polycarbonate bodies and lower-tier processors that struggle to keep up with the resource-heavy applications of 2026. Because they lack the “Longevity Metric” of their flagship counterparts, their value on the second-hand market collapses almost immediately.
Our internal tracking shows that an entry-level phone priced at $250 can lose up to 50% of its value within just six months. By the end of a year, the “Resale Value Figure” might drop to a mere 20% of the original price. This occurs because the hardware reaches its “Functional Ceiling” much faster. When you buy cheap, the secondary market views the device as a “Disposable Asset” rather than a “Resale Asset.” Consequently, the “Realized Cost” of a $250 phone can actually be higher than a flagship when measured against its total utility and eventual recovery value.
The Software Longevity Metric: A New Pivot in 2026
One of the most significant shifts we have witnessed at factsfigure.com this year is the impact of “Software Support Metrics” on resale value. In the past, Android devices depreciated significantly faster than iPhones. However, with major manufacturers now matching the seven-year update cycle, the “Depreciation Gap” is narrowing.
A smartphone that is guaranteed to receive security patches and OS updates until 2033 is a “Secure Asset.” Buyers on the secondary market are willing to pay a premium for this “Extended Utility.” Conversely, entry-level devices that are often abandoned by manufacturers after one or two updates see their value plummet to zero as soon as they are no longer “Safe” to use. This “Software Fact” is now a primary driver of the Resale Value Figure, making long-term support a non-negotiable feature for anyone concerned with hardware ROI.
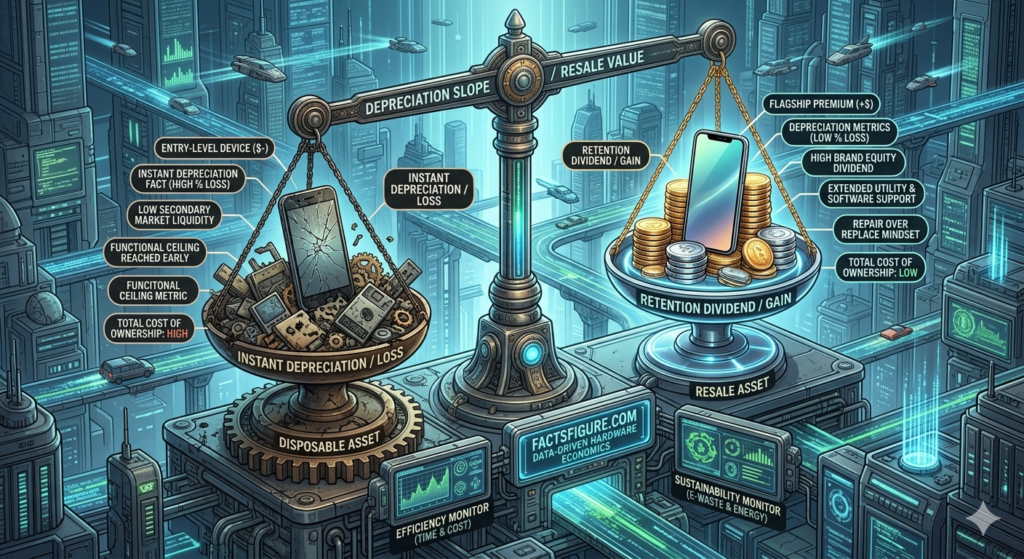
[Image showing a graph of depreciation rates: High-end vs. Budget phones]
The Physical Durability Variable: Protecting Your Asset Integrity
The “Asset Integrity” of a phone—its physical condition—is the gatekeeper of its resale value. High-end devices in 2026 utilize Titanium frames and Ceramic Shield displays, which significantly lower the “Damage Risk Figure.” While these materials are expensive, they act as a form of “Inherent Insurance.”
A flagship phone with minimal scratches can be sold at a “Grade A” price point, whereas entry-level phones, which are more prone to scuffs and screen degradation, often fall into “Grade C” or lower. When calculating your “Maintenance ROI,” using a high-quality case and screen protector isn’t just about aesthetics; it is about preserving the “Capital Recovery” potential of the device. At factsfigure.com, we advise treating your smartphone as a high-value piece of equipment rather than a toy. Every scratch is a literal deduction from your future bank balance.
The Market Cycle Logic: Timing Your Exit for Maximum ROI
Timing is a critical “Economic Variable” in the world of tech resale. The Resale Value Figure is highly sensitive to the “Product Launch Cycle.” Data shows that the best time to sell a flagship device is approximately two months before the announcement of its successor.
During this window, the “Scarcity Metric” is still working in your favor, and the “Obsolescence Fear” hasn’t yet set in. Once the new model is released, the market becomes saturated with used versions of the previous generation, driving down the “Liquidity Price.” For entry-level devices, the timing is even more volatile; because these phones are released frequently and with less fanfare, their value is in a constant state of “Linear Decline.” There is rarely a “Peak Exit Window” for budget devices; the best strategy is usually to use them until they fail.
The “Total Cost of Ownership” (TCO) Figure
To truly understand the “Resale Value Figure,” one must look at the “TCO Metric.” This is calculated by taking the [Original Price + Maintenance Costs] – [Resale Value]. When we run these numbers at factsfigure.com, flagships frequently emerge as the more economical choice over a two-year period.
For example, a $1,200 flagship sold after two years for $500 costs the owner $700 in total. Two successive $350 entry-level phones that are worth $50 each at the end of their respective years also cost the owner $600—but the user has suffered through lower performance, inferior cameras, and poorer screen quality for the entire duration. For a delta of only $100 over two years, the “Utility ROI” of the flagship is vastly superior. This “Value Fact” is why we often advocate for “Buying Up” in the smartphone market.
Mastering the Hardware Economy
The “Resale Value Figure” is the most honest indicator of a smartphone’s true worth. By analyzing the “Depreciation Metrics” of flagships versus entry-level devices, it becomes clear that the cheapest option in the short term is rarely the most efficient in the long term.
As we continue to monitor the tech market at factsfigure.com, our advice remains consistent: prioritize “Brand Liquidity,” “Software Longevity,” and “Physical Integrity.” Whether you are an early adopter or a pragmatic user, understanding the “Figures” behind your hardware will ensure that you are always on the winning side of the technology exchange. Your smartphone is a tool, but it is also an investment. Treat it with the financial respect it deserves, and the “Resale Dividend” will reward you when it is time to upgrade.