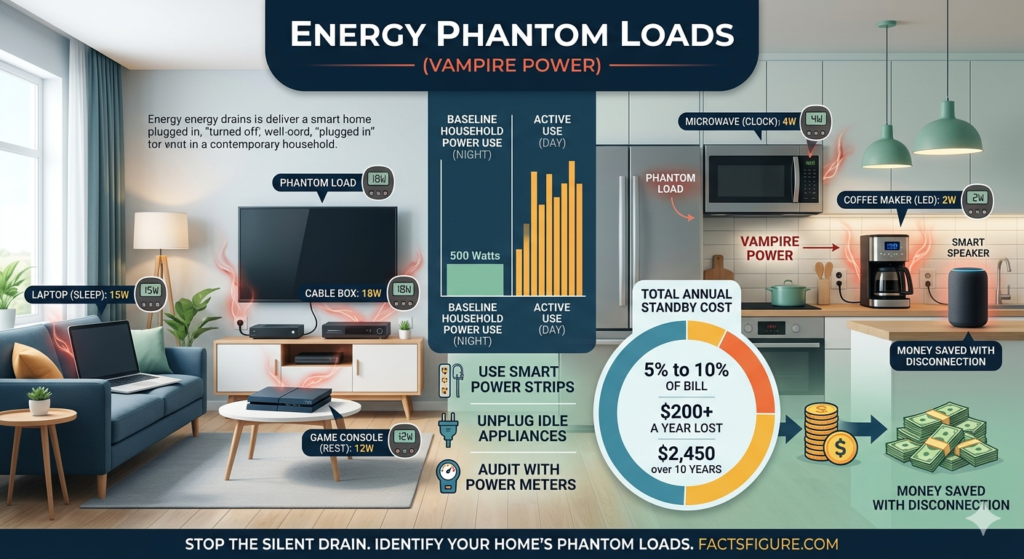
In the quest for household efficiency, we often focus on the “obvious” consumers: the humming refrigerator, the blasting air conditioner, or the glowing television. However, a technical analysis of the average home’s electrical grid reveals a more insidious phenomenon known as Phantom Loads (also referred to as “Vampire Power” or “Standby Power”). These are the invisible energy draws from devices that are “turned off” but remain in a state of constant readiness.
For the analytical community at factsfigure.com, these aren’t just minor inconveniences; they are a measurable financial leakage. Data indicates that standby power accounts for 5% to 10% of total residential electricity use in developed nations. Here is the data-driven list of the worst offenders and the actual annual financial damage they inflict without your knowledge.
The Engineering Behind the Phantom: Why It Happens
From a technical perspective, phantom loads exist to support three primary functions:
Remote Readiness: Keeping sensors active to receive signals from a remote control.
Display Maintenance: Powering LED clocks or status lights.
Instant-On Capability: Keeping internal circuits warm to avoid long boot-up times.
While each individual device may only draw between 0.5 and 20 watts, the aggregate effect across 40+ connected devices in a modern smart home creates a continuous “baseline” draw that never hits zero.
The “Vampire” Hit List: Wattage and Financial Figures
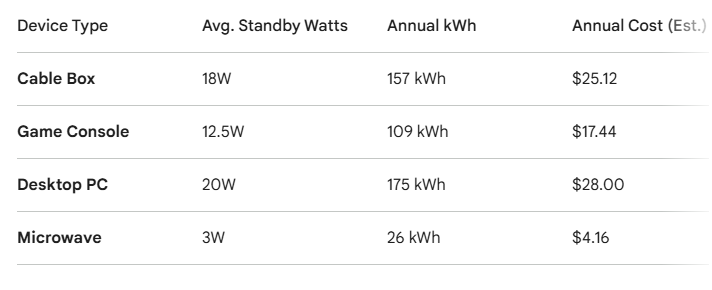
Using an average electricity cost of $0.16 per kWh, we have modeled the annual cost of leaving these common devices plugged in while “off.”
1. The Home Entertainment Hub (The Worst Offender)
The living room is often the epicenter of phantom power. A typical setup involving a smart TV, a soundbar, and a gaming console (in “rest mode”) can draw significant power.
Gaming Consoles (Rest Mode): ~12.5 Watts.
Smart TV: ~1.5 Watts.
Cable/Satellite Box: ~18 Watts (one of the highest standby draws).
Annual Cost: Approximately $45.00 for a single setup.
2. The Home Office and Computing
With the rise of remote work, the home office has become a permanent phantom load.
Desktop Computer (Sleep): ~20 Watts.
Laptop (Plugged in, Fully Charged): ~4 Watts.
Inkjet Printer (Standby): ~5 Watts.
Annual Cost: Approximately $40.00 per office.
3. Kitchen and Small Appliances
Even the smallest devices contribute to the “clutter” of your electric bill.
Microwave (Clock/Sensors): ~3 Watts.
Coffee Maker (Digital Display): ~1.5 Watts.
Smart Toaster/Oven: ~2 Watts.
Annual Cost: Approximately $10.00 for the kitchen suite.
The Financial “Leakage” Figures: The $200+ Truth
When you aggregate these figures, the data becomes startling. A typical 3-bedroom home with multiple TVs, computers, kitchen gadgets, and smart speakers maintains a constant phantom load of roughly 150 to 200 Watts.
The Mathematical Reality:
175 Watts (Continuous) x 24 hours x 365 days = 1,533 kWh.
1,533 kWh x $0.16/kWh = $245.28 per year.
This is money spent on literally nothing. It is a “tax” paid for the convenience of not waiting 10 seconds for a device to boot up or for the pleasure of seeing a digital clock on an appliance you rarely use. Over a decade, this represents a $2,450 loss—enough to pay for a major home improvement or a high-efficiency appliance upgrade.
Technical Solutions: Killing the Vampire
Identifying the problem is only half the battle. At factsfigure.com, we prioritize actionable data. To eliminate these phantom loads, you need to implement “Technical Disconnection” strategies.
1. The Smart Power Strip (SPS)
An SPS technically detects when the “master” device (like a TV) is turned off and automatically cuts power to all “slave” devices (like the soundbar and DVD player). This reduces the standby draw to nearly zero.
Investment: $30.
ROI: 100% payback in less than 9 months.
2. The “Vacation” Master Switch
Most modern homes have circuit breakers that are labeled. If you are leaving for more than 48 hours, the most efficient technical move is to flip the breaker for the “non-essential” zones like the guest room or the home theater.
3. The Power Meter Audit
We recommend a “Kill-A-Watt” meter audit. By plugging individual devices into a meter, you can identify which specific models in your home are “bad actors.” Some older televisions draw as much as 30 watts in standby, while newer Energy Star models draw less than 0.5 watts. Knowing your specific figures allows for targeted replacement.
Final Reflections: The Efficiency of Awareness
The phantom load is a byproduct of our desire for an “always-on” lifestyle. However, when we look at the figures, the cost of that convenience is high. By reclaiming that $245 a year, a household effectively generates a “passive income” simply by changing how they interact with their walls.
At factsfigure.com, we believe that efficiency is found in the margins. The 10% of your bill that vanishes into standby power is the easiest 10% to get back. Start with the cable box, move to the computer, and finish with the kitchen. In the economy of 2026, every watt saved is a figure earned.